

Quantitative Methods
Econometrics is the quantitative analysis of actual economic phenomena based on the concurrent development of theory and observation, related by appropriate methods of inference. At SPIDER Datalab, we train persons on quantitative methods in economics and applied economics (e.g. agricultural economics, energy economics, environment economics, health economics). We train people on using analytical tools such as SPSS, Eviews, etc.

Excel Dashboards
A business dashboard is an information management tool that is used to track KPIs, metrics, and other key data points relevant to a business, department, or specific process. Through the use of data visualizations, dashboards simplify complex data sets to provide users with at a glance awareness of current performance. At SPIDER Datalab, we train people on how to development interactive business dashboard with Microsoft Excel. An advance course will cover the use of visual basic for applications (VBA).

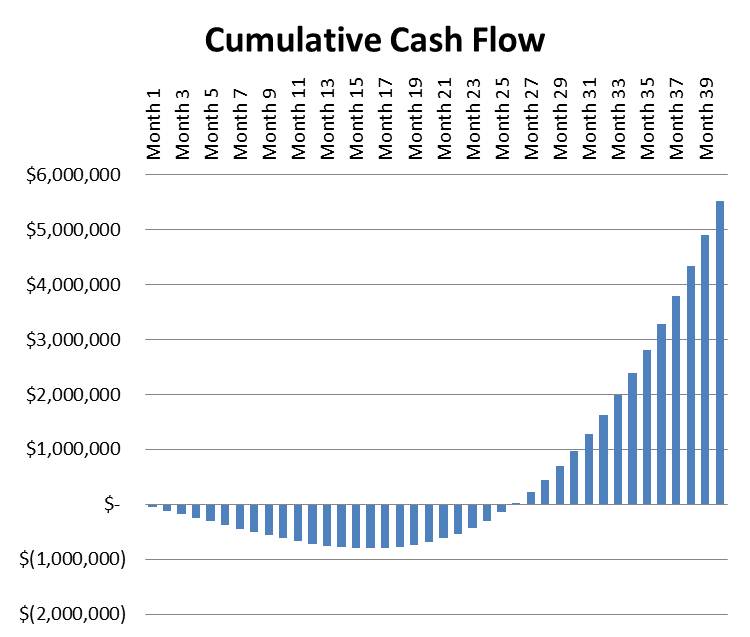
Project appraisal is the process of assessing, in a structured way, the case for proceeding with a project or proposal, or the project’s viability. It often involves comparing various options, using economic appraisal or some other decision analysis technique. At SPIDER Datalab, we train people on how to carry out project appraisals using MS Excel. Our training includes financial and economic modelling to examine key investment parameters such as net present value, rates of returns, payback period and its done by ensuring that all variables that affect the financial viability of a projects may be varied to examine the impact of changes in these variables.

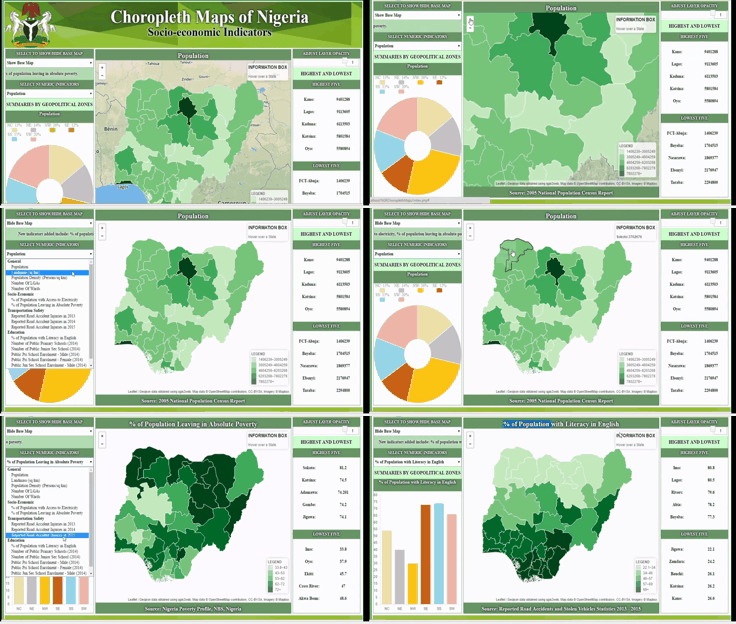
A business dashboard is an information management tool that is used to track KPIs, metrics, and other key data points relevant to a business, department, or specific process. Through the use of data visualizations, dashboards simplify complex data sets to provide users with at a glance awareness of current performance. Dashboards created on desktop using MS Excel can only be accessed by those who have the Excel file. Luckily, this accessibility challenge may be overcome by creating dashboards to be viewed on a web browser. Such dashboards may be hosted on a website and may be accessible to the whole world. At SPIDER Datalab, we train people on how to development interactive business dashboard for the web. We start by teaching basic concepts and web development such as html, css, and javascript and we integrate dashboard development to javascript training

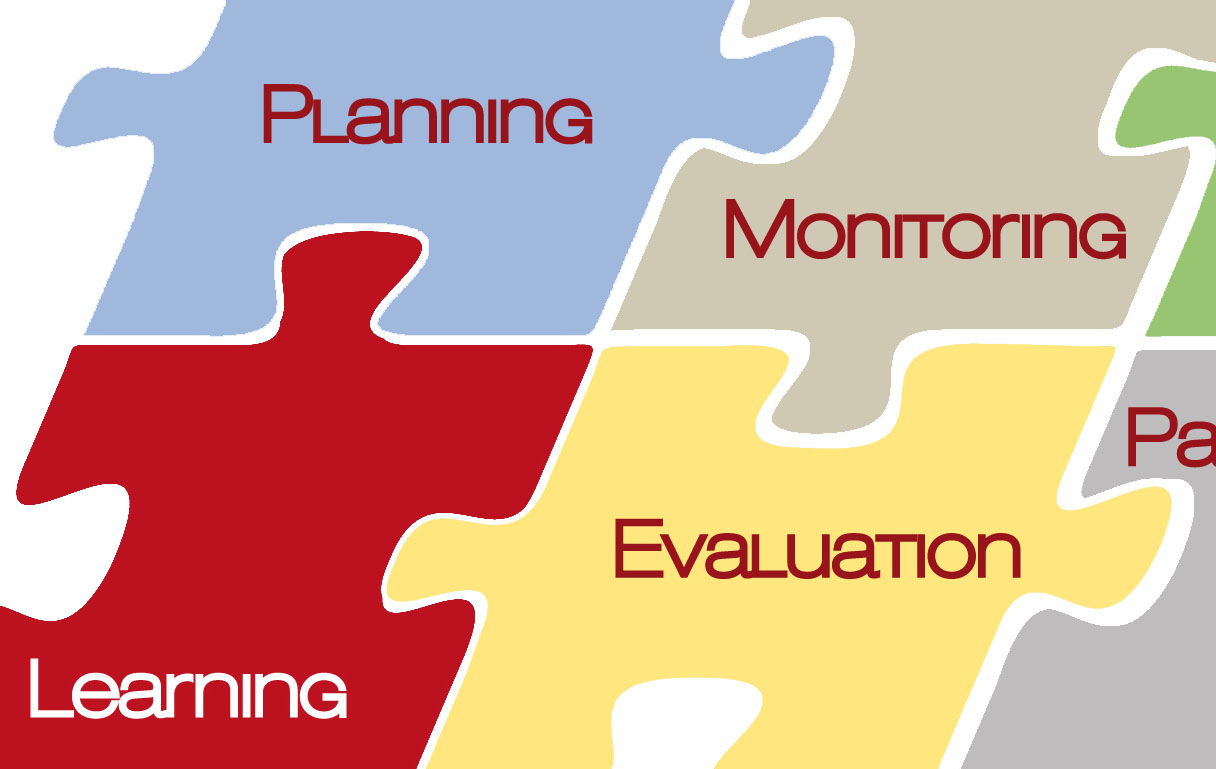
Monitoring and evaluation (M&E) is a process that helps improve performance and achieve results. Its goal is to improve current and future management of outputs, outcomes and impact. It is mainly used to assess the performance of projects, institutions and programmes set up by governments, international organisations and NGOs. It establishes links between the past, present and future actions. At SPIDER Datalab, we introduce trainees to basic concepts in monitoring and evaluation, including procedures, concepts, and tools .
