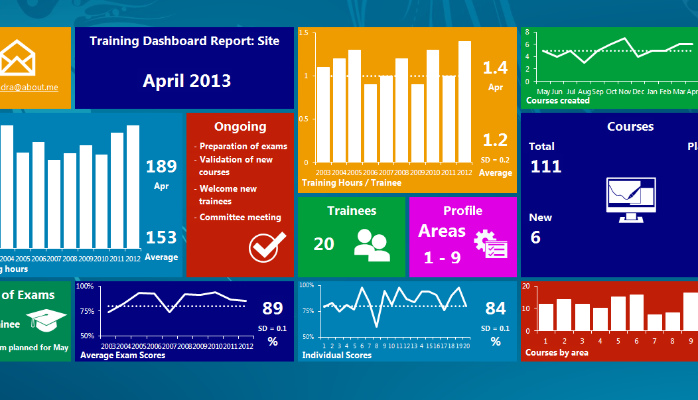
A business dashboard is an information management tool that is used to track KPIs, metrics, and other key data points relevant to a business, department, or specific process. Through the use of data visualizations, dashboards simplify complex data sets to provide users with at a glance awareness of current performance. Dashboards created on desktop using MS Excel can only be accessed by those who have the Excel file. Luckily, this accessibility challenge may be overcome by creating dashboards to be viewed on a web browser. Such dashboards may be hosted on a website and may be accessible to the whole world. At SPIDER Datalab, we train people on how to development interactive business dashboard for the web. We start by teaching basic concepts and web development such as html, css, and javascript and we integrate dashboard development to javascript training